In the course of research my new book I revisiting David Swensen’s book Unconventional Success: A Fundamental Approach to Personal Investment published in 2005. I got to wondering how Swensen’s model portfolio presented in the book held up during what have been tumultuous times in the market.
I first noted the Swensen book on the blog in November 2005. To refresh your memory the portfolio looked like this:
- U.S. stocks 30%
- Foreign stocks (developed) 15%
- Foreign stocks (emerging) 5%
- Real estate 20%
- U.S. Treasury bonds 15%
- Inflation-protected Treasuries 15%
I decided to do some actual research and downloaded dividend-adjusted returns for ETFs covering these asset classes back through November 2005. The ETFs included are VTI, EFA, VWO, VNQ, IEF, TIP. I looked at the data on a monthly basis and looked at a buy-and-hold, monthly rebalancing and annual rebalancing. I compared the annually rebalanced Swensen portfolio against the standard 60%/40% equity/fixed income benchmark using VTI and AGG.
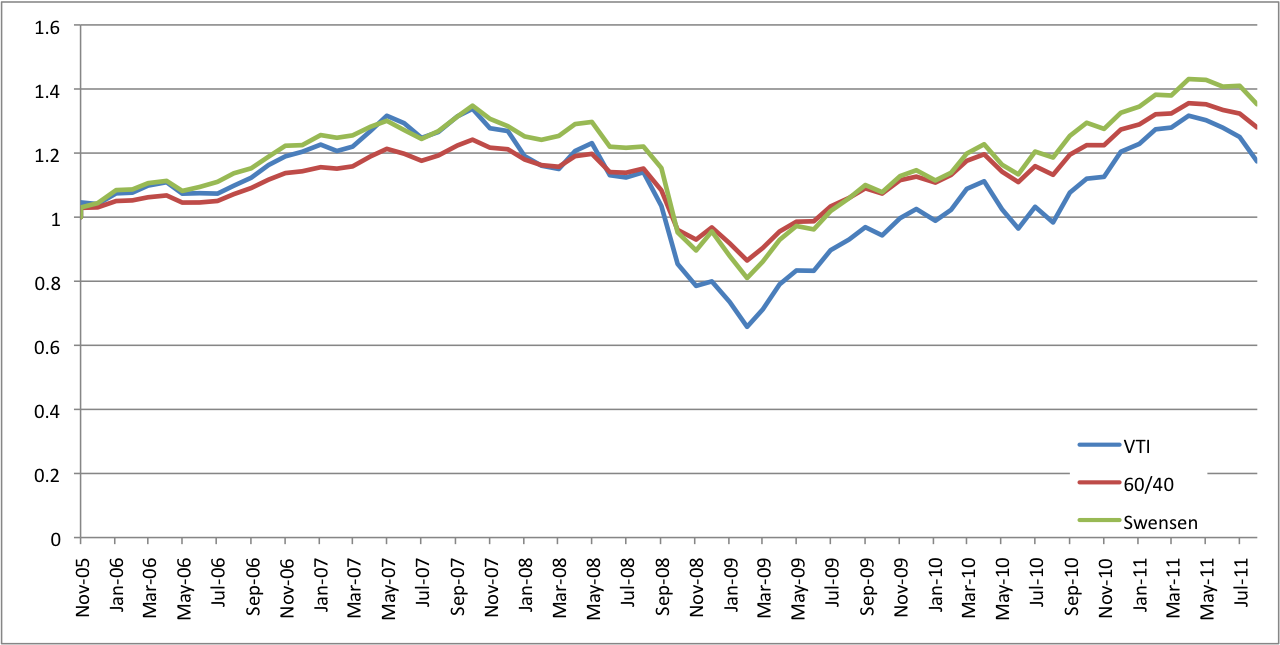
Here’s how things played out from November 2005 through the end of August 2011.

Source: Abnormal Returns (data via Yahoo! Finance)
The Swensen portfolio has higher average returns (6.2% vs. 4.8%) and higher volatility (14.1% vs. 10.5%) than the 60/40 portfolio over this period. The Vanguard Total Stock Market ETF looked worse on both counts (4.2% and 17.5%). I was surprised by the Swensen portfolio’s volatility but emerging markets and REITs over this period were particularly volatile. In both cases reblancing either monthly or annually (marginally) helped returns over this time period.
What lessons can we draw from this simple analysis? Clearly having a fixed income component to the portfolio helped a great deal. Over this entire time period you would have been better off holding the Swensen portfolio vs. the equity index. Domestic equities were the next to worst performing asset class, only developed market equities were worse, over this time period. Adding additional asset classes to the Swensen portfolio helped returns they also added a fair amount of incremental volatility as well. Both diversified portfolios had similar risk/return ratios.
So does the Swensen portfolio hold up? It does, but likely any diversified portfolio would have have had similar performance over this time period. The takeaway is that most investors need not sweat their precise asset allocation. Most broadly diversified portfolios will generate roughly similar results. The point is to find a mix that fits your particular risk tolerance. The investors most disappointed over this time period were those that had portfolios that were too risky which they abandoned at the worst possible time.


